Macro Views: U.S. household debt and credit
Understanding millions of U.S. households’ financial health is crucial in assessing the economy’s overall stability. Private consumption makes up approximately 70% of the U.S. GDP. Identifying the U.S. consumer’s overall health along with other key data sets may determine the current expansion or contraction of the U.S. economy. By taking a deeper dive into consumers’ aggregated household balance sheet and examining household debt size, debt balance growth, and percentage of delinquent debt, we can gauge a bottom-up perspective in the health of the consumer and any stressors that may reveal economic headwinds to come.
U.S. household debt levels
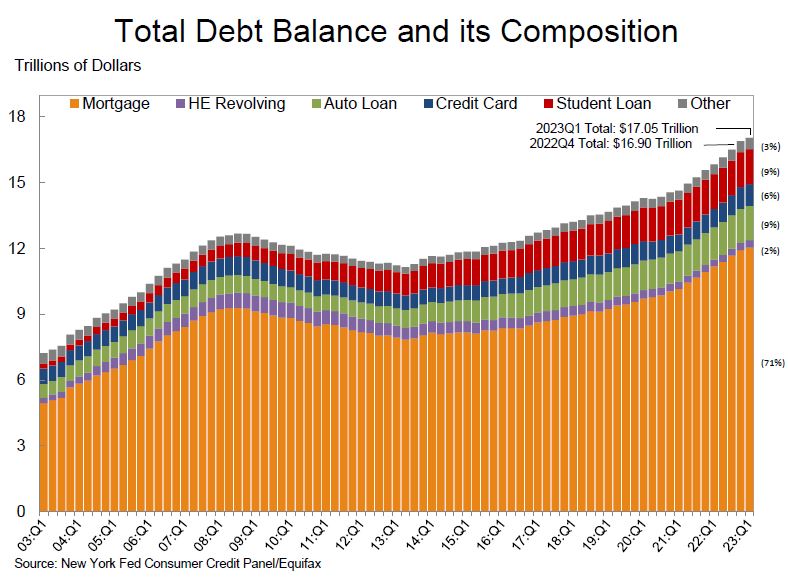
Household debt plays a significant role in a nation’s financial landscape. According to data from the Federal Reserve Bank of New York, as of Q1 2023, the total U.S. household debt stands at $17.05 trillion, up 0.9% from Q4 2022 ($16.9 trillion). This is an increase of $2.9 trillion in total household debt since the end of 2019. The New York Fed’s quarterly report on household debt and credit includes mortgages, home equity revolving line debt, student loans, auto loans, credit card debt and other forms of consumer debt.
Chart 1: U.S. Household Debt Composition

Source: Federal Reserve Bank of New York
The composition of U.S. household debt showed an increase of $121 billion in the first quarter of 2023, while home equity lines of credit (HELOC) increased by $3 billion, totaling $339 billion. This was a fourth consecutive quarterly increase, where HELOC balances were in declining trend over the 13 years prior.
Credit card balances were flat in Q1 2023 at $986 billion but normally decline post fourth quarter seasonal spending. Auto loans increased by $10 billion; though lower than Q4 2022, this continues an upward trend since 2011. Mortgages represent the largest component, accounting for approximately 71% of total household debt. Student loans follow closely with auto loans, each at 9%. HELOC balances stand at 2% and credit card debt makes up 6% of total debt. The other credit consists of retail lines of credit and personal loans and lines around 3%. Auto loans and credit card debt make up 9% and 6%, respectively.
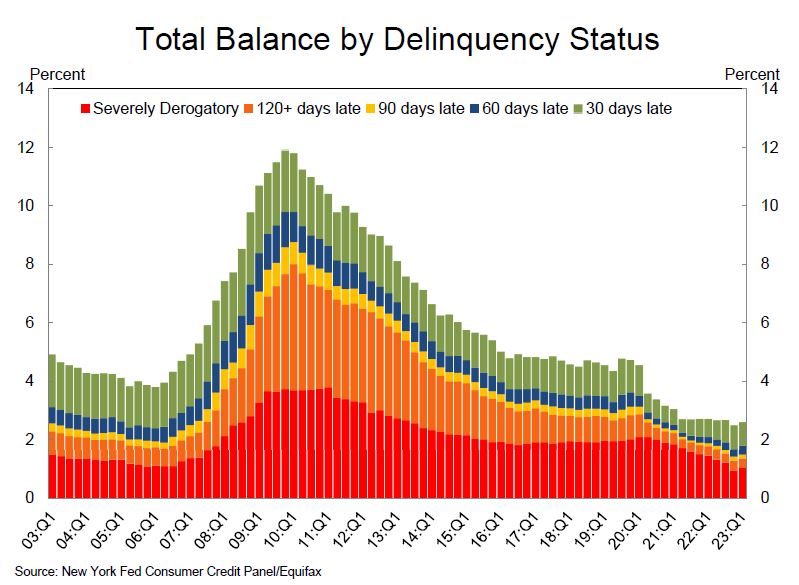
While the levels of household debt are significant, it’s helpful to analyze them in the context of household credit, which reflects the consumer’s capacity to pay their current debt obligations. Aggregate delinquency rates — the data showing households that may be 30, 60, or 90 days behind on their monthly payment obligations — was roughly flat in Q1 2023 and have remained low since the beginning of the pandemic. As of March 31, 2.6% of outstanding debt was in some stage of delinquency. It’s hard not to view this recent data on household credit maintenance to be resilient despite current inflationary conditions for consumers. As for student loans, delinquency fell substantially due to the implementation of the Fresh Start Program, which made previously defaulted loan balances current. This skews the data tables when it comes to monitoring credit health on outstanding student loan debt.
Chart 2: Total Balance by Delinquency Status

Source: Federal Reserve Bank of New York
Personal income > disposable income > personal savings
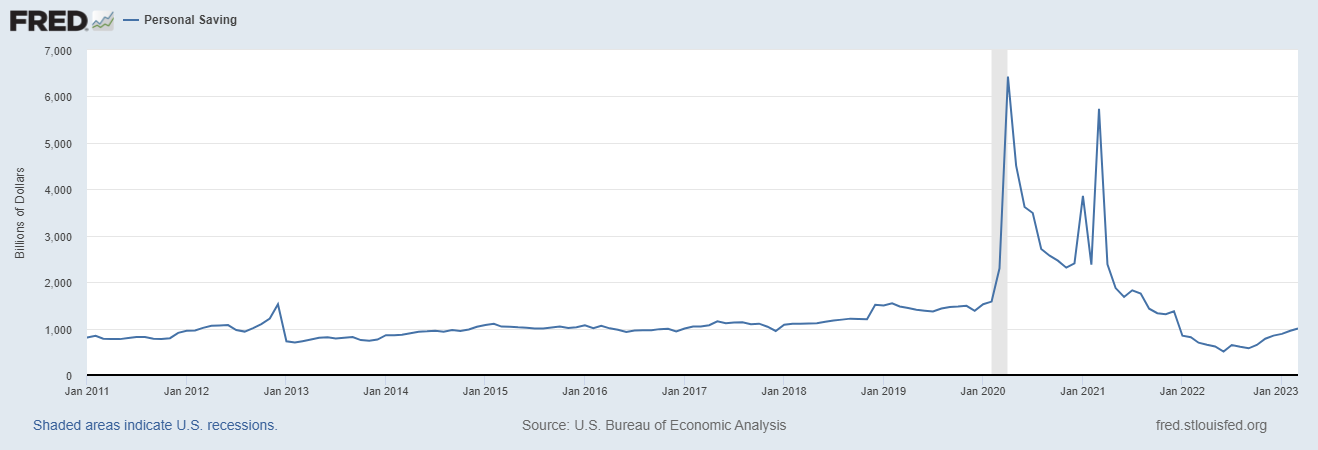
According to the Bureau of Economic Analysis, personal income increased $67.9 billion or 0.3% in March 2023. Disposable personal income (DPI) increased $71.7 billion or 0.4%, and personal consumption expenditures (PCE) — also the target that the Federal Reserve manages its current interest rate policy — was at $8.2 billion or less than 0.1%. A simple translation to these figures means that private sector wages and salaries are still rising. This increase in compensation has contributed to a rise in disposable income (the residual money left over after household liabilities paid) has pushed personal savings back to $1 trillion, a 16% increase from personal savings levels at the end of 2022.
The savings rate — the percentage of disposable income that households save on average — was at 5.1%, up from 4.4% in December 2022. There was a good amount of financial media chatter criticizing personal savings in 2022, as households drained their excess savings from $1.8 trillion in May 2022 to $506 billion in June of 2022. The expectation was that consumers were going to continue to draw from their savings and eventually turn to their credit cards to float their current spending lifestyles, given an elevated inflationary backdrop. The combination of a strong labor market and a cooling inflationary condition on many consumer goods has provided a tailwind to personal savings over the past six months.
Chart 3: U.S. Personal Savings

Source: https://fred.stlouisfed.org/series/PMSAVE#
Debt-to-income and debt service
To gain a deeper understanding of household debt burdens, it is crucial to analyze debt-to-income and debt service ratios.
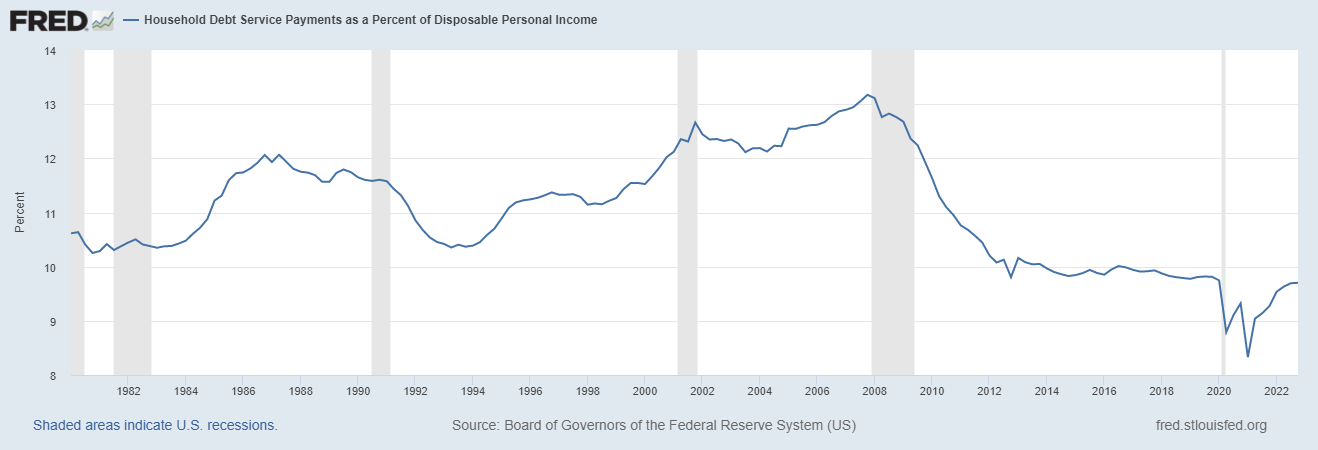
The debt-to-income ratio measures the proportion of debt payments to household income. At the end of 2022, the household debt service payments as percentage of disposable income were 9.7%. The debt service ratio assesses the ability of households to manage debt payments. This suggests that households, on average, allocate around 9.5% of their disposable income toward servicing debt obligations. Current household debt service remains lower than the long-term 11.07% average.
Chart 4: Household Debt Service Payments as a Percentage of Disposable Income

Source: St. Louis Federal Reserve Bank
U.S. household debt continues to be a significant concern, with total debt just over $17 trillion. However, it is crucial to consider this in the context of household income and debt service ratios. Approximately 71%, or $12.07 trillion of total household debt, consists of mortgage loans with many homeowners locked in at record-low interest rates. Many established homeowners have experienced a real estate wealth effect with the average available home equity at approximately 50%. Due to higher wages, more disposable income and personal savings, levels have almost doubled the low from last June. The personal savings rate is back on the rise to 5.1% — much higher from the June 2022 2.7% low as well as the average savings rate of 3% between 2005 and 2007, just before the Great Recession circa 2008.
While high levels of household debt pose risks to financial security, the stability in debt-to-income and low-credit delinquencies suggests that households, on average, can manage their current debt obligations. Household incomes have increased, especially for those in jobs on the lower labor income spectrum. It has been said that “a large tide rises all boats.” This large tide of increased wages and tight labor markets does not come without its own repercussions, especially when it comes to inflation. Inflation may be influenced by supply and demand, but the increased labor cost in wages or wage inflation is where the inflation wick is ignited. The Federal Reserve can curb inflation with monetary policy by raising interest rates. However, the U.S. economy may be in need of fiscal policy from our elected officials on Capitol Hill — since proposed laws, such as corporate tax and immigration reform, may have a more direct impact on reducing wage inflation than the blunt instrument of the Fed’s monetary policy. If the U.S. economy was a patient with chronic pain caused by inflation, and surgery was the only way to alleviate the pain, fiscal policy would be the scalpel while monetary policy is more of a chainsaw. Though many remain cautiously optimistic in regard to U.S. economic conditions for the remainder of 2023, wouldn’t it be interesting to know how to acquire the scalpel if the economy is going to have the soft landing that many U.S. economists would like?
Chris Brown, Vice President — Investments, Synovus Securities, Inc.
Important disclosure information
The views, opinions and positions expressed are those of the referenced authors at the time of publication and are based upon information available at that time. There can be no assurance that any of the beliefs and views expressed herein will prove to be accurate, and actual outcomes or events may vary significantly from those presented. The authors’ views are subject to change and do not reflect the views, opinions or positions of Synovus Financial Corp, who makes no representations as to accuracy, completeness, timeliness, suitability or validity of information presented and will not be liable for any errors, omissions, or delays in this information or any losses, injuries or damages arising from its display or use. The information provided in this material is intended to highlight present economic and market conditions in general. It does not constitute any recommendation, and is not meant for use as personalized or individual investment advice. We encourage you to speak with your financial professional concerning your specific investment goals and risk tolerance before making investment decisions.

