Learn
Did Small Caps Just Make ‘Fetch’ Happen?
By Chris Brown, CIMA®, CRPC™
Vice President — Investments
“That is so fetch!” It’s one of the most memorable lines from “Mean Girls,” the 2004 comedy. The context of “fetch” refers to something as being cool, exciting, fresh, or desirable. Most likely, short for the English term “fetching.” The character Gretchen uses the word “fetch” in hopes that everyone in their school will start using her catch phrase as the new “it” word. This is until Gretchen is verbally backhanded by her high school clique leader, Regina George. “Gretchen, stop trying to make ‘fetch’ happen! It’s not going to happen!”
The markets have felt the same way about the small cap index trying to make “fetch happen” after three years of extreme underperformance, since the beginning of 2021.
The small cap index — companies with a market capitalization between $250 million and $2 billion — had a moment of outperformance over the S&P 500 and NASDAQ in November 2020, which peaked in March of 2021. In hindsight, I would argue that this reversal was the first sign of inflation not being just transitory but an ominous sign to indicate higher rates on the horizon.
For the past 40 months the small cap index, specifically the Russell 2000 (IWM), has been in a down trend when compared to the S&P 500 (SPY) and NASDAQ 100 (QQQ) large cap stocks. This underperformance of the small cap index has left many market participants underinvested and has given way to the overcrowding of investors in mega-cap growth stocks or “The Magnificent 7” (Alphabet, Amazon, Apple, Meta Platforms, Microsoft, NVIDIA and Tesla) stocks.
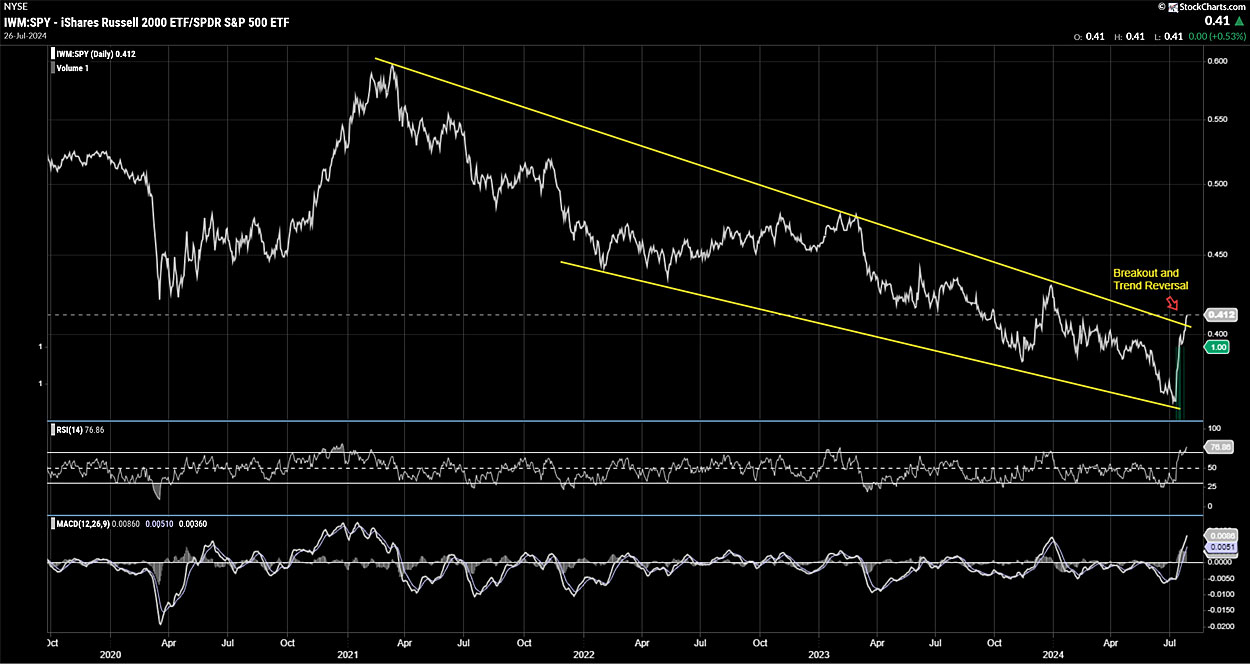
Over the past few weeks, we have seen a role reversal and breakout of the small cap index versus the S&P 500.
This is indicated in the ratio chart below. The charts show the IWM divided by the S&P 500 ETF, SPY. A ratio chart is used to compare the performance of two different stocks, asset classes, or indices. Simply, we just divide the price of one index by the price of another. Based on the ratio chart below, IWM’s price has recently broken above the downward sloping trendline. The longer IWM stays above the trendline channel, the stickier the trend reversal can become.

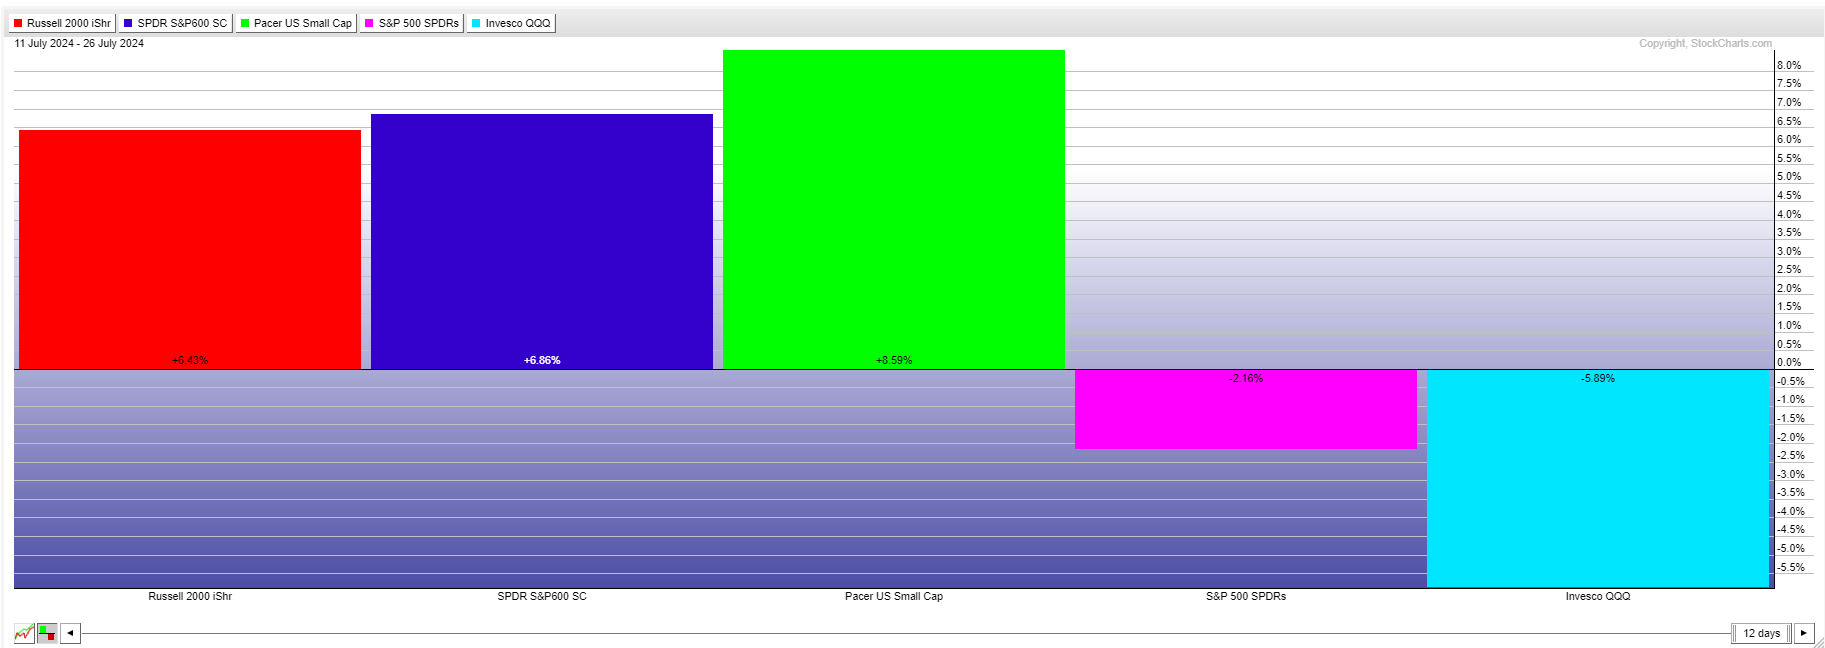
Over the past 3 weeks the markets have seen a massive rotation from large cap equities to the small cap index. In July, the IWM and the S&P 600 Small Cap Index (SPSM) has outperformed SPY by 8% and QQQ by 11%. The chart below shows the overall performance of the Russell 2000 (IWM), S&P 600 (SPSM) and the Pacer US Small Caps ETF (CALF) compared to SPY and QQQ during this past July.

Small Cap Catalysts
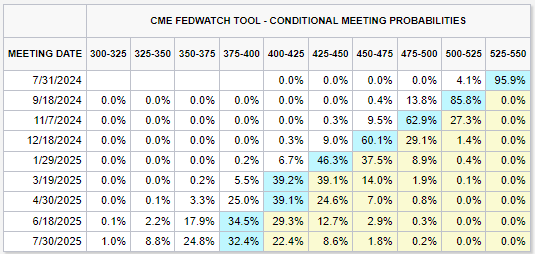
One catalyst for the Small Cap Index to rally in July came after June’s Consumer Price Index (CPI) July 11 report, which showed a larger slowdown in U.S. inflation than forecasts estimated. The Bureau of Labor Statistics (BLS) reported CPI fell 0.1% in June 2024 (seasonally adjusted). This marked the lowest Month-over-Month (MoM) inflation reading since June of 2023. The lower-than-forecasted CPI reading led both the stock and bond markets to price in a higher possibility for a September rate cut. The CME Group’s FedWatch Tool displays an 86% chance of a 25 basis points (BPS) rate cut for September, compared to 58% prior to the June CPI report. A near-term interest rate cut points to a more bullish signal for small caps since smaller companies are more impacted by the current interest rate environment compared to their large cap counterparts.

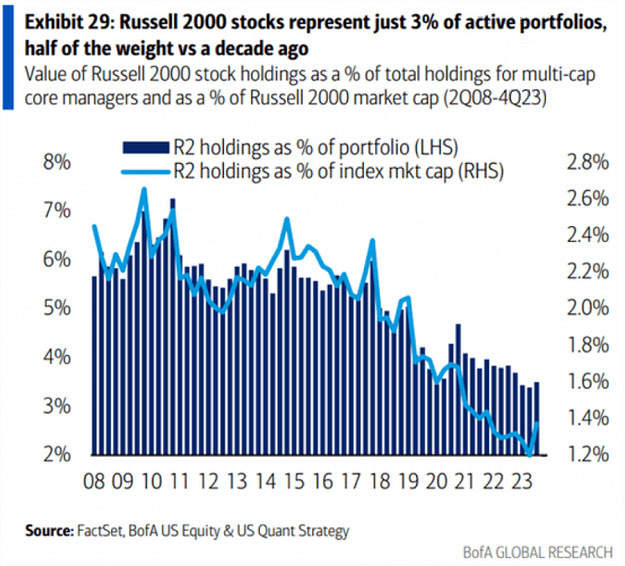
The second catalyst for the small cap index rally is the long-term underinvestment in the asset class leading to attractive prices. Based on the Bank of America Global Research, IWM is only represented by 3% of active portfolios, which is only half the weighting versus small cap weightings in active portfolios a decade ago.

This underinvestment in small caps resulted in attractive stock prices when compared to their large cap counterpart, the SPY & QQQ, which may have been priced for perfection in the short term, showing a price-to-earnings (p/e) of 27.45 and 30.91, respectively. However, the Russell 2000 index currently shows a 29.69 p/e ratio, but this is a bit misleading. Approximately 50% of the Russell 2000 index has had negative earnings and those companies are left out of the overall calculation, making a p/e ratio a less reliable measure for valuation within the index. A better measurement of a small cap p/e ratio may be indicated within the Pacer US Small Cap ETF, CALF (also shown in Chart 2). This ETF owns an even weighting of the top 100 small cap companies with positive p/e and a tilt to high cash flow to enterprise value of the company. The current p/e ratio of the Pacer US CALF ETF is 6.86 (as of July 26). When measuring small cap firms with positive earnings, this indicates an attractive p/e compared to SPY and QQQ.
A Continuation?
There is no conclusive evidence the rotation into small cap stocks over the S&P and QQQ will continue. The first week of August presented an opportunity for large cap stocks, where many of these companies needed to pass muster when it comes to the Q2 2024 earnings season. SPY is down 3.75% off of its all-time high and QQQ decreased approximately 8% from its all-time high. The questions will be whether the artificial intelligence (AI) trade has gotten a bit too far over its skis, or will this be another opportunity of “dip buying” for investors looking for a small pullback in stocks to redeploy sidelined cash and create a secondary continuation for the leaders of the equity markets? At this point, there is no telling what happens next. The best advice I can provide for equity investors is diversification in asset classes. Diversification when investing in the equity markets is a time-tested approach that allows investors to have some upside participation in the unlikely event that “fetch” actually happens.
Important disclosure information
Asset allocation and diversifications do not ensure against loss. This content is general in nature and does not constitute legal, tax, accounting, financial or investment advice. You are encouraged to consult with competent legal, tax, accounting, financial or investment professionals based on your specific circumstances. We do not make any warranties as to accuracy or completeness of this information, do not endorse any third-party companies, products, or services described here, and take no liability for your use of this information.
