Learn
A Strong U.S. Economy Produces Stubborn Inflation
By Chris Brown, CIMA®, CRPC™
Vice President — Investments
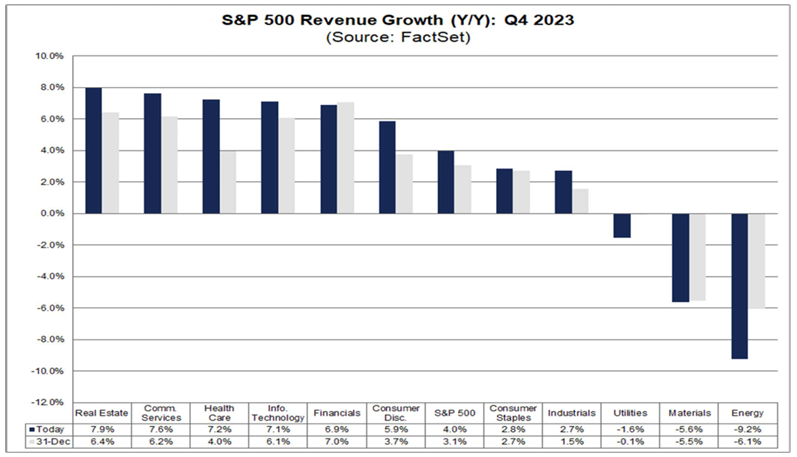
As we commence the last part of the Q4 2023 earnings season, approximately 97% of the S&P 500 companies have reported results. Of those that have filed results, 73% of S&P companies have reported a positive earnings per share (EPS) surprise and 64% have reported a positive revenue surprise. Earnings growth rate is 4% and marks the second straight quarter of S&P corporate earnings growth. Annual EPS estimates for 2024 by Standard & Poors, as of November 2023, had been as low as $220 compared to the current EPS of $245.1 Revenue growth is projected to come in at 4.2%, marking the 13th consecutive quarter of revenue growth for the index.2 Of the 11 sectors of the S&P, positive revenue growth for Q4 2023 have been led by Real Estate, Communication Services, Financials and Technology. Sector laggards for Q4 2023 revenue growth were Materials, Energy and Utilities. As a result, the S&P 500 is up 7%, the Dow is up 2.6%, and the NASDAQ composite is up 6.56% YTD.
Inflation
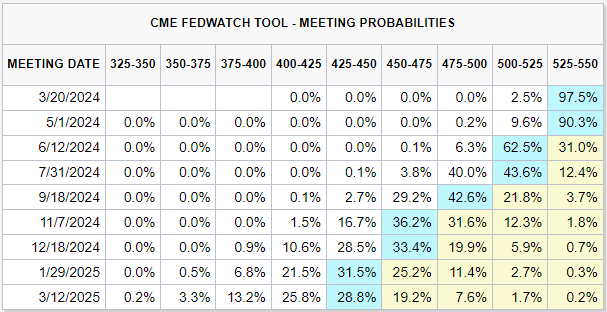
The January 2024 inflation rate came in higher than expected at 3.1% versus the expected inflation rate of 2.9%. Though January’s inflation was a 0.3% decline from December 2023, the year-over-year (YOY) annual core inflation (inflation rate minus food and energy) rate came in at 3.9%, which was also 0.2% higher than expected. Market reactions created a 1.37% selloff in the Dow and S&P 500 on February 13 while sending bond yields climbing with the 10-year Treasury going from 4.15% to above 4.30%. This reduced any chance for a March 2024 the Federal Reserve (Fed) rate cut and amplified doubts of a May 2024 Fed rate cut. The inflation numbers for February, reporting on March 12, will determine if the Fed remains higher for longer or prepares for its first rate cut since March 2020. The CME FedWatch Tool measures the likelihood of changes in the Fed rate as implied by the 30-Day Fed Funds futures pricing data. Based on the table below, the probability of a rate cut in May is currently 9.6%, compared to a 62.5% probability rate cut in the June Fed meeting.
Jobs Are Still Available
The Initial Jobless Claims numbers on February 22 showed the number people claiming unemployment benefits came in at 201,000 with an expectation of 218,000. This drop in unemployment claims suggests that unemployed individuals are still having an easier time in finding a suitable job. Most important, the ability to find employment so quickly has created a “spenders’ mindset” for U.S. consumers who are unfazed by the odds of not bringing home a paycheck. This may suggest that many households will continue their spending habits with some households using credit cards to backfill their “buy-now-pay-later” lifestyle.
Make More Spend More
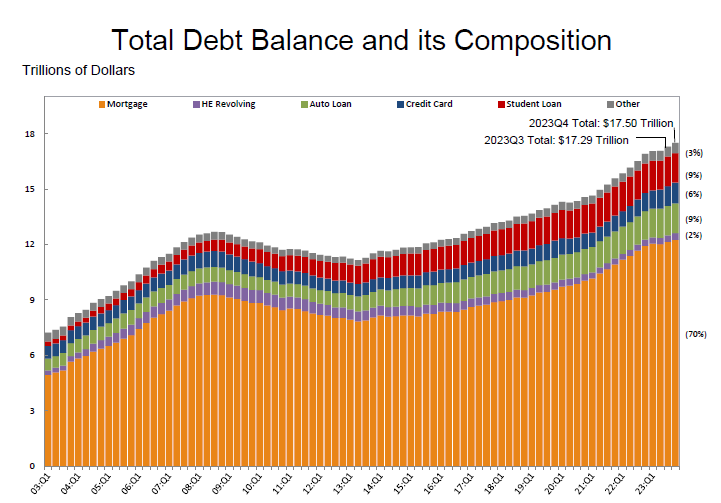
I’m sure many of you have heard the term “the more you make, the more you spend” or “as your income increases, so does your lifestyle.” Based on the Q4 2023 Fed Household Credit and Debt Report, released by the Federal Reserve Bank of New York, the total U.S. household debt has climbed to $17.5 trillion, with credit card balances going above $1 trillion for the first time. Though the total U.S. household debt is at record highs, this number is a bit misleading since 70% of household debt is comprised of mortgage debt, which reflects the recent increase in mortgage loan interest and home values. Credit card debt comprises 6.45% of the total household debt. Furthermore, the ratio of credit card balances is approximately 20% compared to the credit limits — on average.
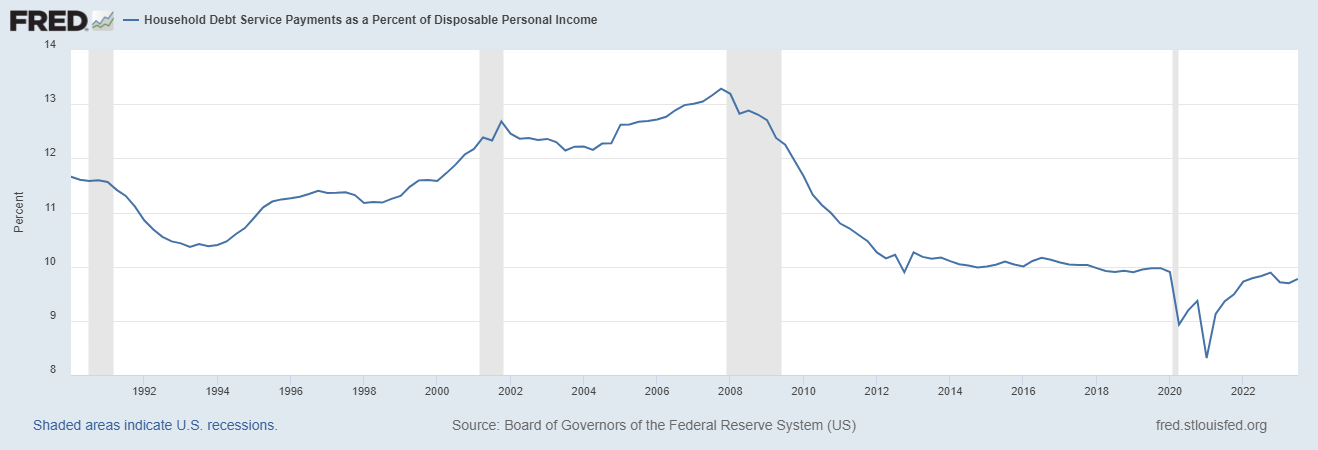
There is a second part to this story that is far less mentioned. This would be the increased disposable income for U.S. households. Based on the FRED Chart below, the U.S. households debt service as a percentage of the household disposable income is still within multi-year lows, at 9.7%. This would indicate that households still maintain further spending power since overall debt payments are still manageable based on this 34-year track.
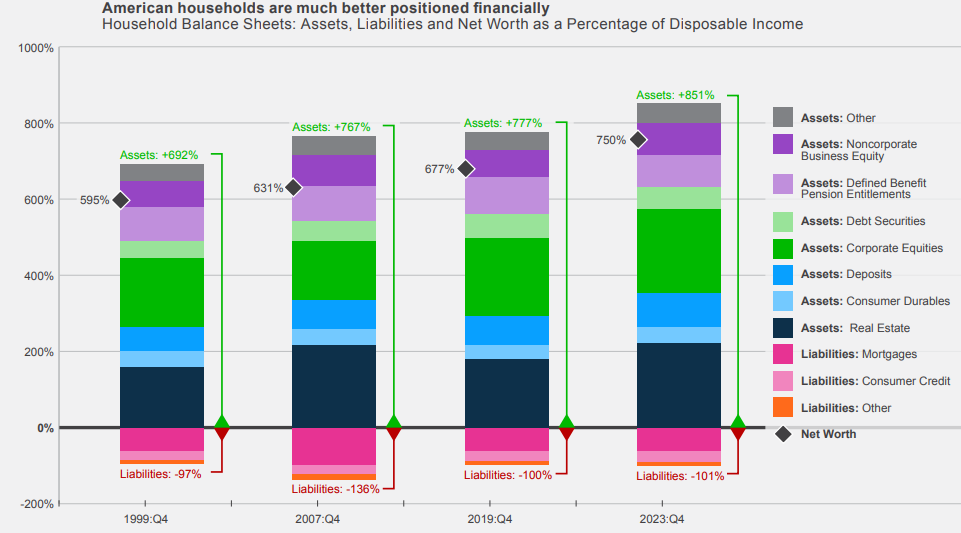
Carson Group Chief Market Strategist Ryan Detrick further elaborates on the strength of U.S. households in its Carson Group Outlook 2024. The chart below measures household balance sheets of assets, liabilities and net worth as a percentage of disposable income.
Detrick said, “As a percentage of disposable income, household net worth is now 750%, much higher than the 677% just before the pandemic.”
This is mostly due to the wealth effect created in increasing asset prices in real estate, stock and bond investments and business equity. Also keep in mind that the percentage of U.S. homeowners without a mortgage is approximately 40% and 65% of those with existing mortgages pay 4% or less on their annual mortgage interest.
Lower Income Wage Gap Is Contracting
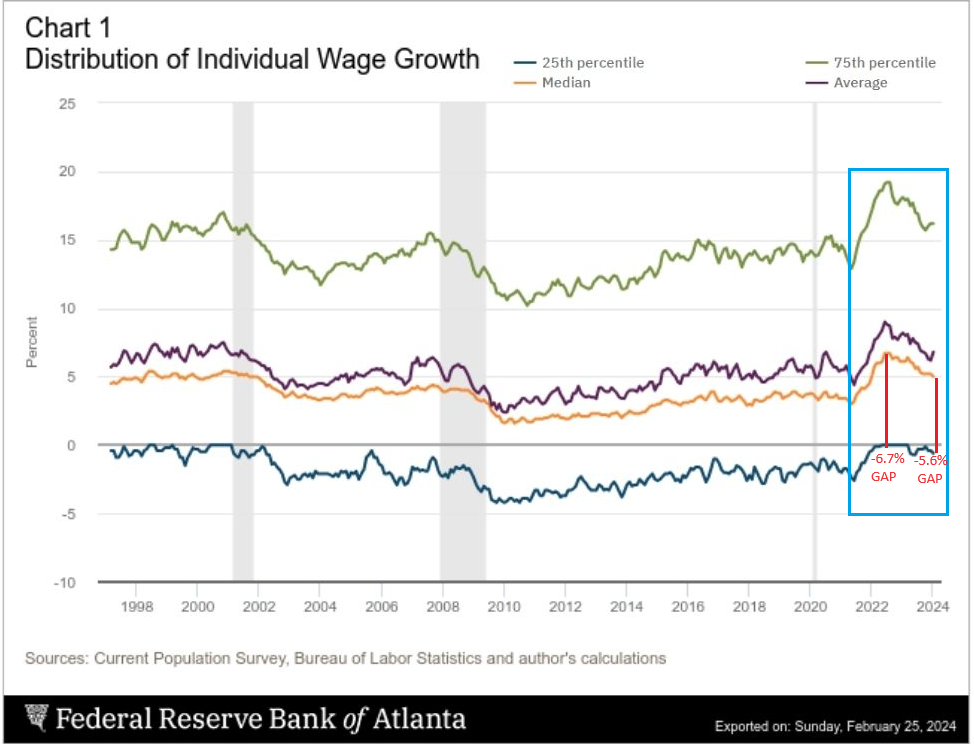
Inflation has taken a toll on many households struggling to maintain their essential daily living purchases, yet the data for lower income households have experienced a lift in income since pre-COVID wage levels. Based on the Atlanta Fed’s Wage Tracker, the disparity between the median individual wage growth and bottom 25 percentile of wage growth was below 5.6% compared to median income and the bottom 25 percentile of negative 6.7% in June 2022. This means wage growth for the bottom 25 percentile of income earners has increased 16% when measured against the median wage growth over this time. This would be a larger reduction in wage growth disparity when compared to the 75th percentile during this same period, of 9.6%.
In summary, household debt is high, household income is high enough to service existing debt and overall household net worth is recording record highs, as a percentage of disposable income. Credit spreads between high quality treasury and junk bonds remain intact. S&P earnings and revenue growth have remained consistently strong for many S&P sectors.
Artificial Intelligence has bolstered many of your large cap tech firms due to heavy demand for semiconductors and computing power. Economic analysts like Goldman Sachs and UBS have raised their S&P calendar year-end price targets. So, my question would be, with all this good economic data, why would the Fed cut rates at all in 2024? The risk of cutting rates too quickly could stoke the fires of an already hot economy and potentially reignite inflation rates back toward the 2022 highs. It seems like the Fed will have to continue its monetary cat and mouse game with favorable economic conditions until we see further reduction in inflation or the Fed’s “north star indicator," the Price Consumer Expenditures (PCE).
Important disclosure information
Asset allocation and diversifications do not ensure against loss. This content is general in nature and does not constitute legal, tax, accounting, financial or investment advice. You are encouraged to consult with competent legal, tax, accounting, financial or investment professionals based on your specific circumstances. We do not make any warranties as to accuracy or completeness of this information, do not endorse any third-party companies, products, or services described here, and take no liability for your use of this information.
- https://seekingalpha.com/article/4652543-fall-2023-snapshot-of-expected-future-s-and-p-500-earnings Back
- https://insight.factset.com/sp-500-reporting-year-over-year-revenue-growth-for-13th-straight-quarter Back

