Learn
Secular Over Cyclical and a Tailwind Thesis
By Chris Brown, CIMA®, CRPC™ Vice President — Investments
Many economists and economic forecasters are predicting a near-term U.S. recession due to economic signals in the bond market’s inverted yield curve, slowing non-farm payrolls, as well as challenges with near-term corporate debt that will be resetting at much higher interest rates for small- and medium-sized businesses over the next 12 to 24 months. It’s also helpful to understand that economic slowdowns and recessions in economic business cycles are natural occurrences within a functional economy. There are two types of economic cycles: the cyclical and the secular cycles. Cyclical markets are shorter-term economic trends — referring to terms like business cycles. A general business cycle of expansion, peak, contraction and trough can be anywhere from 18 months to seven years. In this market update, let’s spend time addressing some data points on the longer-term secular economic cycles that are less talked about in the fast-paced media outlets.
Secular markets refer to market activities that unfold over long time horizons and are not heavily influenced by short-term factors.1 A secular trend can refer to both long-term bull and bear market trends. These trends tend to last from 10 to 20 years in duration. An examination in broad market secular trend allows long-term investors to review data while minimizing the noise of the shorter-term cycle. There could be a prospective tailwind when assessing our current secular market trend — U.S. population demographics.
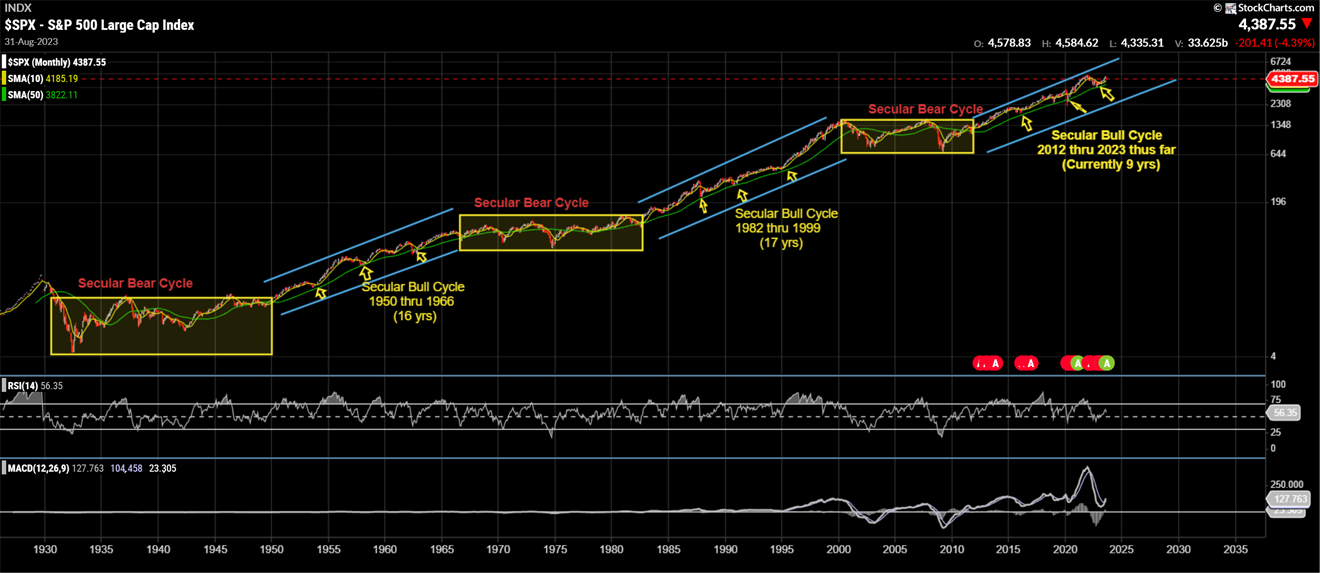
There are thoughts that the bull market secular trend started in 2012. Over the past 90 years, the U.S. economy has experienced two previous secular bull market trends in the S&P 500. The first secular bull market occurred from 1950 to 1967 and the second happened from 1982 to 2000. In the chart below you can see the long-term secular bull and bear market cycles that have occurred over the past 90 years within the S&P 500.
The S&P 500 indicates the two prior bull market cycles — with the upward sloping blue brackets — within a multi-year time horizon. The bull market in the 1950s, also known as “The Nifty Fifty,” was a time of economic expansion led by U.S. manufacturing and infrastructure activity for a post-World War II growing U.S. population. This time is also known as the building of modern America, a secular trend that lasted approximately 16 to 17 years. Four recessions occurred during the first secular bull market and two recessions occurred during the second secular bull market of the 1980s and ‘90s. It’s important to mention because it’s easy for investors to feel psychological discomfort in their investment plan even in the best long-term bull market cycles. During these long-term market trends, volatility — in one form or another — remains present during a secular uptrend and is only revealed to investors in the rearview mirror.
Demographics
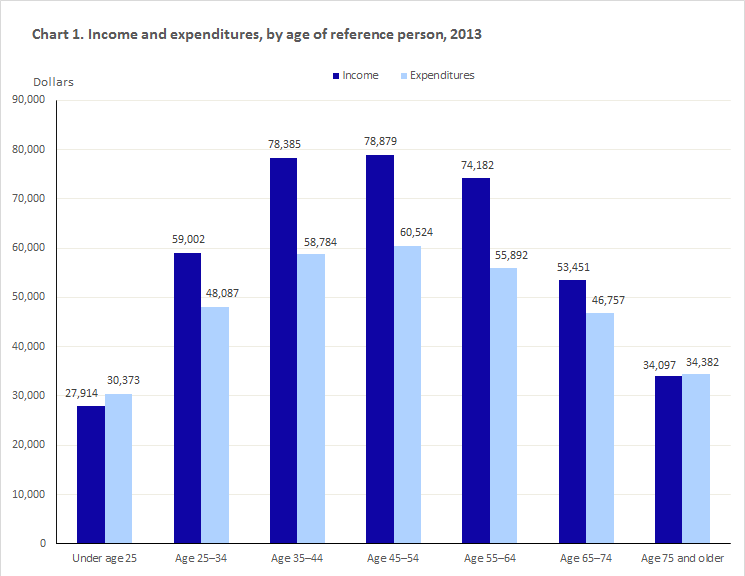
If there is strength in numbers, then demographics may be a larger contributor to overall long-term economic growth than many give credit. Though there are many factors that influence the success and breakdown of economic conditions, the human capital influence can provide some insight for future income and consumption statistics. Over the past 70 years, it can be argued that human behaviors and essential needs have not changed much but may have evolved based on new technological advancement. Based on the figures in the chart below, the U.S. Bureau of Labor Statistics displays age relative to income and expenditures (consumption). As you can see, the individuals representing up to 25-years-old and those 75 and older are at the lower income and consumption levels, resulting in low economic impact when it comes to growth and productivity. The highest income and expenditures are between the ages of 35 and 54 years that, in turn, have the highest impact on economic growth and productivity. These are considered the peak earning years for U.S. consumers where income is greater than consumption. The 35-to-54 age group tends to be more productive during this point of their career due to workforce skills and experience. This is relevant to secular economic expansion because economic growth is measured by a country’s gross domestic product (GDP). Approximately 70% of GDP is comprised of consumption of goods and services. It’s plausible to say that as demographics go, so goes the economy.

Source: U.S. Bureau of Labor Statistics
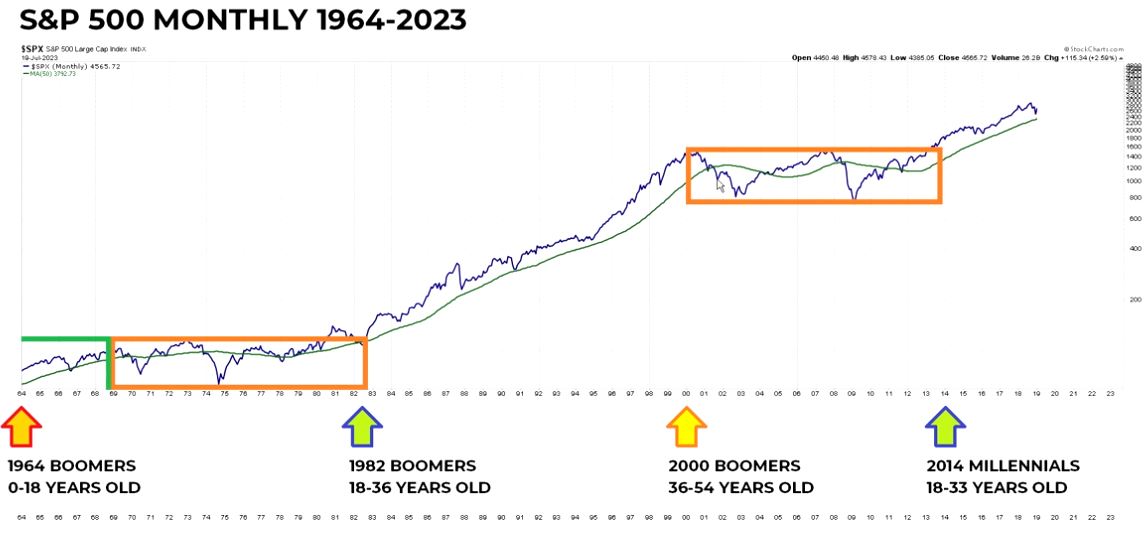
So, let’s tie this together. Baby boomers had been one of the largest generations in the U.S. consisting of approximately 74 million people. The birth years for boomers track from 1946 to 1964. According to the S&P 500 Monthly chart below, you can see that in 1982 the oldest group of boomers (born in 1946) just started to reach their top earning years and began aging beyond the 54-year-old peak earnings years circa 2000. It just so happens that during this time of high growth and consumption, new industries came forth that included a large technology boom (i.e., internet proliferation and usage) and made way for market bubbles to bust — leading the U.S. economy into a recession and eventually secular bear market cycle for the next 10 years. Many market experts named this the “Silent Decade” since the S&P 500 had an average return of only 0.5% from 2001 through 2010. Fast forward to 2014 and the millennial generation (birth years between 1981 to 1995). Millennials account for 72 million people in the U.S. and started aging into their peak earning years in 2014, which will continue until the older band start turning 54 in 2035.
Further assessment of U.S. demographics, as well as understanding years of peak income and expenditures, may provide some explanation on our current economic conditions related to inflation, tight labor markets and a strong consumer demand. In her article “Demographics and Their Implications for the Economy and Policy,” Federal Reserve Bank of Cleveland President and CEO Loretta Mester wrote: “Demographic change can influence the underlying growth rate of the economy, structural productivity growth, living standards, savings rates, consumption and investment; it can influence the long-run unemployment rate and equilibrium interest rate, housing market trends, and the demand for financial assets.”3
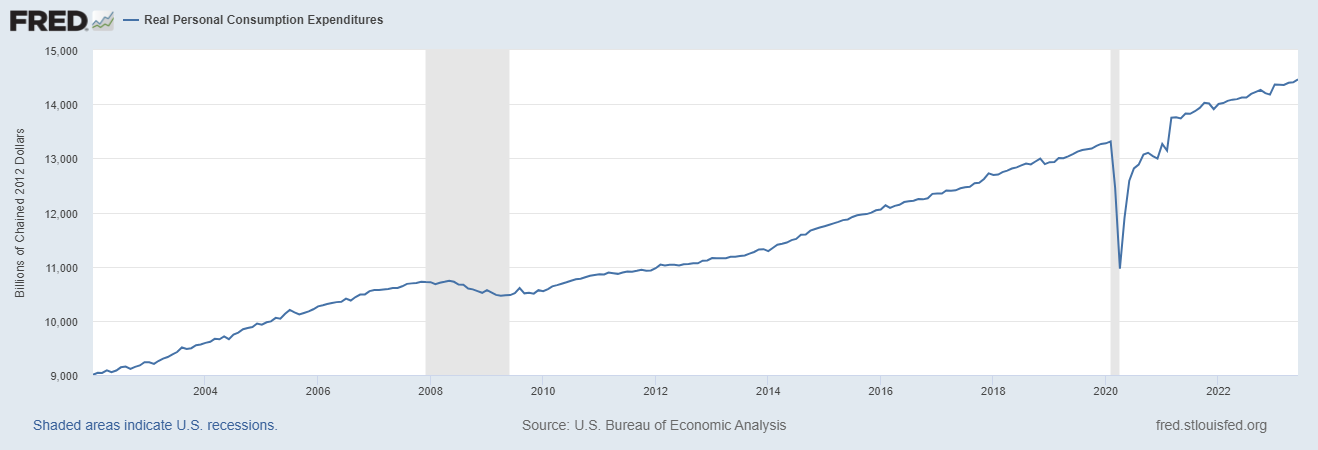
We are seeing evidence of this today with robust consumer demand throughout many industries, including residential real estate, energy consumption and manufacturing service. The chart below shows the real personal expenditures over the past 20 years. The consumer expenditures rate of change has increased .75% year-over-year for the past decade, compared to the previous 10 years (2002 through 2012).
The correlation of the secular bull market cycle and growing demographics approaching their peak earning years is an interesting phenomenon to pay close attention to over the next five to seven years. Scrolling out and viewing the markets over long-term cycles may help investors understand macro trends beyond cyclical and seasonal volatility, while encouraging market participants to stay invested for the long term. Creating a long-term financial plan, knowing your risk tolerance and time horizon can help investors endure near term volatility in exchange for long-term investment success.
Important disclosure information
The views, opinions and positions expressed are those of the referenced authors at the time of publication and are based upon information available at that time. There can be no assurance that any of the beliefs and views expressed herein will prove to be accurate, and actual outcomes or events may vary significantly from those presented. The authors’ views are subject to change and do not reflect the views, opinions or positions of Synovus Financial Corp, who makes no representations as to accuracy, completeness, timeliness, suitability or validity of information presented and will not be liable for any errors, omissions, or delays in this information or any losses, injuries or damages arising from its display or use. The information provided in this material is intended to highlight present economic and market conditions in general. It does not constitute any recommendation, and is not meant for use as personalized or individual investment advice. We encourage you to speak with your financial professional concerning your specific investment goals and risk tolerance before making investment decisions.
- Alexandra Twin, "Secular: What It Means in Stock Investing, With Examples," Investopedia, published April 6, 2022; accessed September 24, 2023. Back
-
Reserve Bank of Cleveland President and CEO - https://www.clevelandfed.org/en/collections/speeches/2017/sp-20171116-demographics-and-their-implications-for-the-economy-and-policy#cf-fn-ret-22
Back


