Learn
A Year-End Economic Review
By Chris Brown, CIMA®, CRPC™
Vice President — Investments, Synovus Securities, Inc.
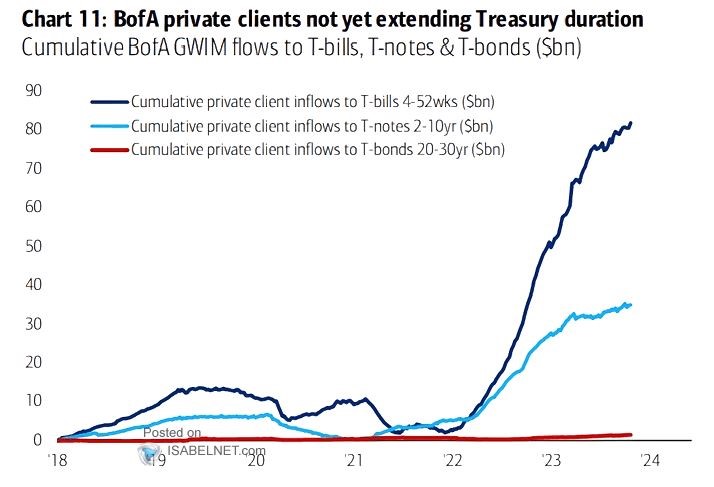
As we enter the holiday season, let’s take a quick look at the ghosts of market pasts. Investors left the tumultuous 2022 market performance grasping for their cash, and that was with the Federal Reserve (Fed) helping to create one of the largest consumer inflows in U.S. Treasury Bills (T-Bills) in more than a decade. The BofA Global Investment Strategy chart below shows the cumulative inflows of private client accounts near $80 billion of 1 month through one-year T-Bills. Furthermore, one-to-12-month T-Bill rates have an average yield of 0.50% to 1% higher yield compared to the two-, five-, seven-and 10-year treasury notes. Many baby-boomer aged investors, apprehensive Generation X and millennial stock and bond investors — as well as small businesses with large cash reserves — could easily avoid the worries of FDIC deposit limitations, created in March of 2023 by the failures of a few high-risk regional banks. They were able to buy a short-term cash equivalent, or “CD-like” investments earning above 5%. The higher, Fed-imposed interest rate environment created new disposable interest income for households and businesses that otherwise would be earning less than 1% in most checking and savings accounts. The Fed’s aggressive rate-hiking policy of 2022 and early 2023 may have perpetuated further U.S. consumer spending in the economy by creating a new income avenue for savers and wealthy investors. Many U.S. T-Bill investors with $1 million in cash reserves were able to create just more than $50,000 in interest income in 2023. This may be one contributor in the recent jump in household disposable personal income numbers from $18.3 billion to $19.9 billion in year-over-year (YoY) growth since the start of the Fed rate hikes (March 2022 to March 2023).
Not All Consumers Are Created Equal
The U.S. consumer represents nearly 70% of the U.S. gross domestic product (GDP) related to the economy. The U.S. economy thrives on the consumption of goods and services. A fundamental premise for U.S. consumers effects on GDP is that one person’s consumption of a good or service is another person’s (or businesses’) income from that good or service. This exchange happens a million times over in multiple micro-economies within the U.S. and this is how we are able to create one of the most important measurements of our GDP and economic health. U.S. consumer health is a direct correlation to the overall economic health of our nation. One underlying consumer health measurement is examining household debt and credit.
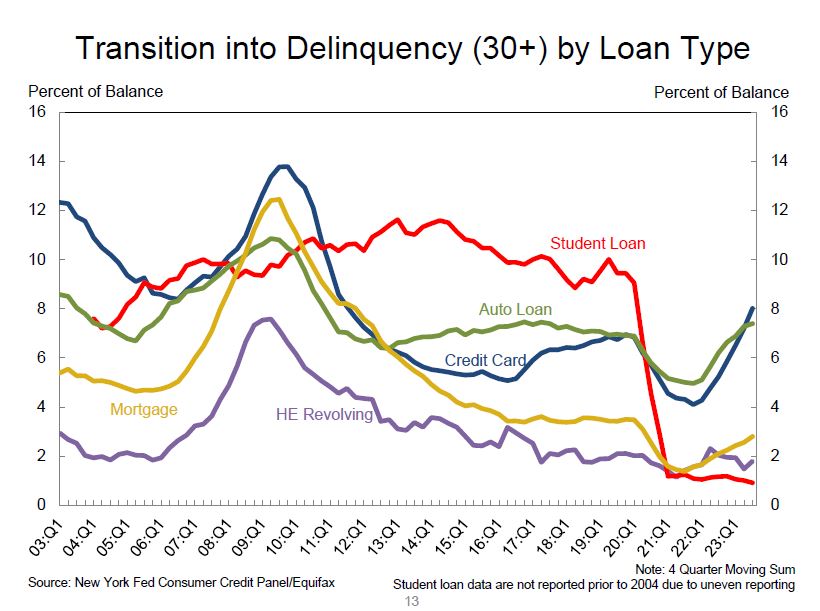
Last month the New York Federal Reserve published its quarterly Household Debt and Credit Report for the third quarter (Q3). One of the charts that I monitor every quarter is the total balance by delinquency status. This shows how many households are either 30, 60, 90, or more days delinquent on their outstanding debt. In Q3 the report showed an increase of credit card and auto loan delinquencies, which ticked up from the second quarter.
According to the New York Debt and Credit Report, “Annualized, approximately 8% of credit card balances and 7.4% of auto loan balances transitioned into delinquency; with credit card delinquency transitions showing a 0.8 percentage point increase. Increases in credit card delinquency were the sharpest among borrowers between ages 30-39.”
This is something we want to monitor in the incoming quarters since it appears that some consumers may finally be feeling the inflation pinch when it comes to repaying their outstanding credit card debt.
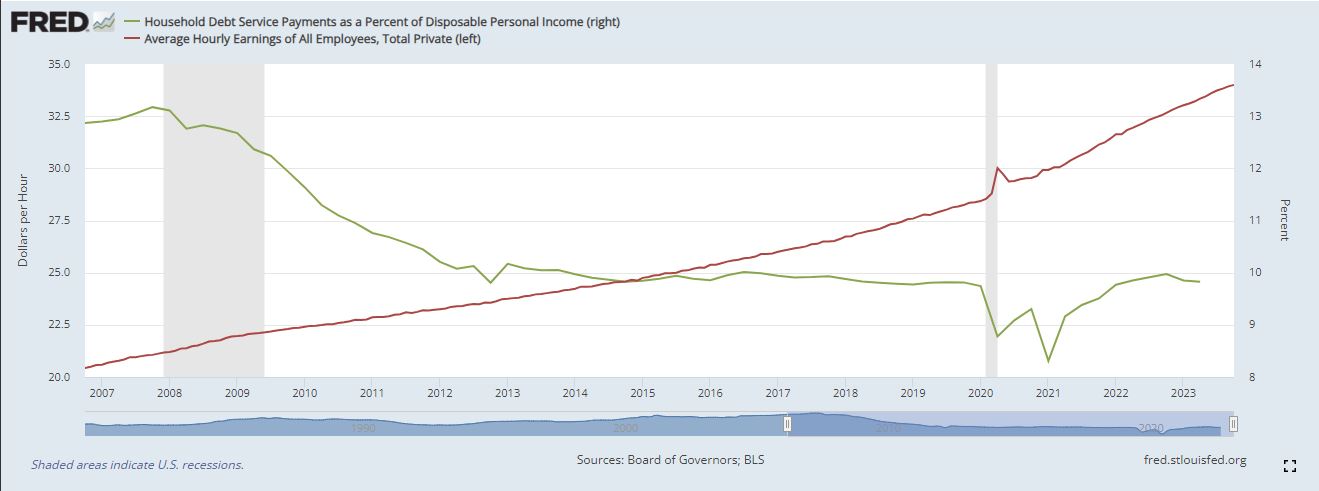
Some U.S. consumers may be facing some financial stresses but if we scroll out, let’s take a look at a longer-term chart on the growth of average hourly wages (left column) and the household debt service as a percentage of disposable personal income (right column). Since a peak in 2008, the U.S. household had an approximated debt service of 32.5% of their disposable income (measured quarterly). Due to tight labor markets and increases in hourly wages of our current post-pandemic economy, today’s average household debt service is less than 10% of household disposable income. This is more than a two-thirds decline of debt service payments as a percentage of disposable personal income. This may indicate that U.S. consumer still has capacity to spend. Overall U.S. consumer health remains strong with lower income households feeling the most financial stress at this time.
The Secular Bull Market Is Intact
As we wrap up the year, the S&P 500, NASDAQ and Dow Jones indices are in a time of positive seasonality for all three indices to close above 10% for the year, barring any geopolitical or black swan market event. For the first time in 18 months, inflation shows signs of continued decline. This was confirmed by the October Consumer Price Index (CPI), which showed a softer-than-expected inflation report. CPI is the measurement of month-over-month and annual inflation within the U.S. economy. The largest brick in the wall of worry has been reduced to a much more manageable level.
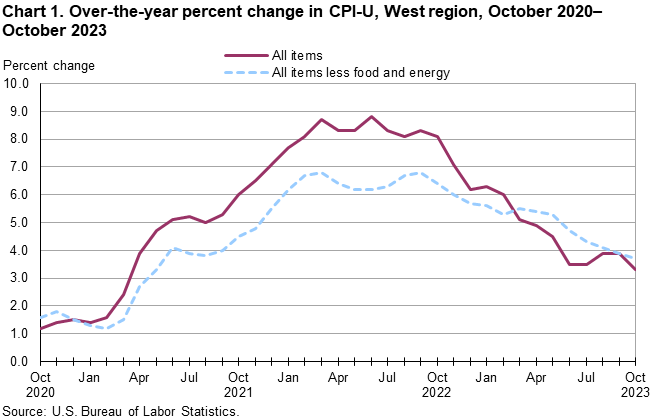
The October CPI number provided an additional indication that the Fed may be on pause for further future rate hikes. This news created a major snapback in the markets from the October 31 4,103 low on the S&P 500. In the monthly S&P 500 chart, we examine the long-term technical indicators for an upward sloping moving average (multicolored lines) and the current price holding above the orange line, representing the 40-month exponential moving average. Secular bull markets are not immune to short volatility and cyclical economic recessions. Reviewing a long-term time horizon on the S&P 500 helps create a clearer directional movement picture of the overall markets.
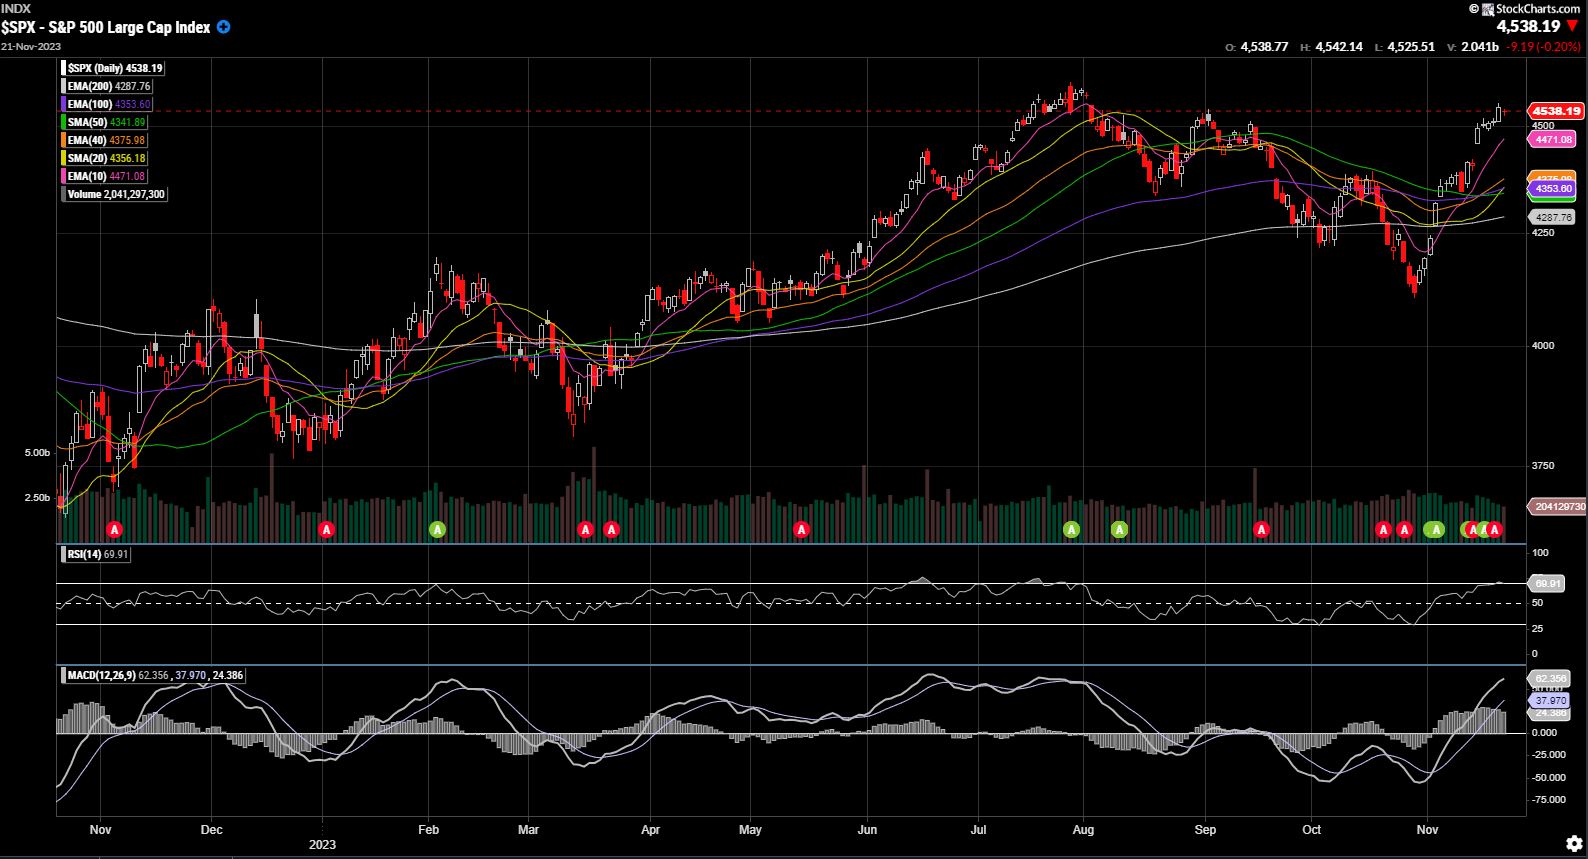
In summation, no one can predict what’s going to happen in the markets for 2024. After all, most economists called for a U.S. recession by the end of 2022 and then restated a recession is most likely coming in 2023. All we can do is analyze the data that we are given and provide a thesis on how markets may react to the data at hand.
What we do know is:
1. The U.S. consumer remains strong and labor markets remain tight, providing steady paychecks and direct deposits for many consumers who are responsible for two-thirds of the GDP performance.
2. U.S. credit spreads remain intact, which means that many households are not staring down the barrel of a near-term debt crisis like 2008 and 2009.
3. Market trends are holding up due to better-than-expected corporate earnings and a lift in stock and bond prices due to falling inflation. Investing in the equity and bond markets always comes with uncertainties based on new and reoccurring events. Uncertainties may center around myriad events including, but not limited to, economic slowdowns, inflation, U.S. elections or geopolitical events.
Creating a customized financial plan that addresses your personal goals, investment objectives, risk tolerance and investment time horizon can help insulate you from the wall of worries that remain constant in any risk-based investment.
On behalf of Synovus team members, we wish you and your loved ones a happy holiday season and prosperous New Year.
Important Disclosure Information
This content is general in nature and does not constitute legal, tax, accounting, financial or investment advice. You are encouraged to consult with competent legal, tax, accounting, financial or investment professionals based on your specific circumstances. We do not make any warranties as to accuracy or completeness of this information, do not endorse any third-party companies, products, or services described here, and take no liability for your use of this information. Diversification does not ensure against loss.

